23-County Regional Benchmarks & Executive Read
Across the 23 counties of Northeast and Eastern North Carolina, active inventory stands at 3,427 residential listings with 8,990 trailing 12-month closed sales as of 2026-11-04. The regional median months of supply sits at 4.69 months (interquartile range: 3.91 months at the 25th percentile to 6.19 months at the 75th percentile)—placing the region squarely in a balanced-to-warming regime where tight commuter and soundfront markets contrast with looser rural interior counties.
Supply is tightest in Greene (3.04 mos), Gates (3.15 mos), Currituck (3.42 mos), Pitt (3.72 mos), Pasquotank (3.86 mos), and Wayne (3.91 mos), where turn-key homes under $350,000 routinely clear at 99%–100% of asking price. Buyers seeking wider selection and 4%–6% negotiation room find deeper inventory in Bertie (6.58 mos), Martin (6.42 mos), Northampton (6.42 mos), Edgecombe (6.38 mos), and Perquimans (6.19 mos).
Use the interactive 23-county leaderboard and side-by-side comparison tool below to benchmark any 2 to 4 counties across supply, prices, HUD Fair Market Rents, weekly wages, and cash-buyer share—or click through to any county's dedicated 11-section report.
Regional median sold-to-list sits at 98.3%, with 7 counties clearing at 99.0%–100.0% of list price. Accurate price-band positioning in the first 21 days determines whether a listing captures full ask or sits past 60 days.
Comparing adjacent counties can save $40,000–$130,000 on comparable single-family homes—for example, comparing Currituck ($480k median) with Camden ($422k), Pasquotank ($319k), Gates ($297k), or Chowan ($285k).
HUD FY2027 3-bedroom Fair Market Rents range from $1,150–$1,350/mo in inland corridor counties (where median prices sit under $210k) up to $1,586–$2,150/mo in coastal and Virginia-border counties.
BLS PPI residential construction inputs are up +2.4% YoY while NVR, Inc. (Ryan Homes) maintains a 23.4% audited homebuilding gross margin. Lot availability and municipal water/sewer capacity remain the primary constraints across the 23-county footprint.
Compare All 23 Northeast & Eastern NC Counties
Filter by market segment or click any column header to sort the 23 counties by Composite Score, Months of Supply, Active Inventory, Median List Price, or Days on Market. Click any county name to open its full 11-section county report.
| Rank ↕ | County & Hub Town ↕ | Score ↕ | Band | Months Supply ↕ | Active ↕ | Median List ↕ | Median DOM ↕ | Price-Cut % ↕ | P&I Share | 3BR FMR | Weekly Wage | Unemp. |
|---|---|---|---|---|---|---|---|---|---|---|---|---|
| #1 | Gates CountyGatesville | 79 | Hot | 3.15 mos | 23 | $297,450 | 28 days | 99.5% | 29.2% | $2,291 | $1,181 | 3.9% |
| #2 | Currituck CountyCurrituck & Moyock | 77 | Hot | 3.42 mos | 134 | $480,135 | 24 days | 100.0% | 30.5% | $2,298 | $1,823 | 3.9% |
| #3 | Greene CountySnow Hill | 75 | Hot | 3.04 mos | 34 | $276,250 | 50.5 days | 99.1% | 30.9% | $1,265 | $1,034 | 3.9% |
| #4 | Pasquotank CountyElizabeth City | 75 | Hot | 3.86 mos | 195 | $319,000 | 23 days | 100.0% | 29.1% | $1,689 | $1,268 | 3.9% |
| #5 | Pitt CountyGreenville | 74 | Hot | 3.72 mos | 671 | $284,500 | 34 days | 100.0% | 28.8% | $1,518 | $1,144 | 3.9% |
| #6 | Camden CountyCamden | 73 | Hot | 4.06 mos | 64 | $422,145 | 28.5 days | 100.0% | 30.9% | $1,889 | $1,579 | 3.9% |
| #7 | Wayne CountyGoldsboro | 71 | Warming | 3.91 mos | 374 | $270,000 | 47 days | 100.0% | 28.3% | $1,516 | $1,106 | 3.9% |
| #8 | Wilson CountyWilson | 70 | Warming | 4.21 mos | 242 | $259,900 | 32 days | 99.1% | 28.8% | $1,356 | $1,045 | 3.9% |
| #9 | Chowan CountyEdenton | 69 | Warming | 4.35 mos | 80 | $285,000 | 32 days | 98.3% | 28.2% | $1,586 | $1,169 | 3.9% |
| #10 | Beaufort CountyWashington | 63 | Warming | 4.74 mos | 191 | $314,950 | 38.5 days | 96.9% | 30.4% | $1,320 | $1,197 | 3.9% |
| #11 | Nash CountyRocky Mount & Nashville | 63 | Warming | 4.93 mos | 353 | $279,900 | 59 days | 100.0% | 28.4% | $1,567 | $1,140 | 3.9% |
| #12 | Lenoir CountyKinston | 62 | Warming | 5.43 mos | 187 | $225,000 | 43 days | 98.9% | 27.7% | $1,273 | $939 | 3.9% |
| #13 | Perquimans CountyHertford | 60 | Warming | 6.19 mos | 100 | $316,000 | 40 days | 99.1% | 28.8% | $1,440 | $1,269 | 3.9% |
| #14 | Washington CountyPlymouth | 58 | Warming | 4.11 mos | 27 | $134,500 | 42.5 days | 96.3% | 22.5% | $1,401 | $690 | 3.9% |
| #15 | Hertford CountyAhoskie & Murfreesboro | 58 | Warming | 4.63 mos | 23 | $177,250 | 57 days | 96.5% | 25.1% | $1,401 | $819 | 3.9% |
| #16 | Dare CountyManteo & Outer Banks | 58 | Warming | 4.90 mos | 384 | $585,000 | 58 days | 96.4% | 1.4% | $1,825 | $44,700 | 3.9% |
| #17 | Edgecombe CountyTarboro | 58 | Warming | 6.38 mos | 154 | $183,100 | 48.5 days | 98.5% | 24.7% | $1,567 | $857 | 3.9% |
| #18 | Martin CountyWilliamston | 57 | Balanced | 6.42 mos | 79 | $150,000 | 36 days | 97.0% | 23.1% | $1,325 | $753 | 3.9% |
| #19 | Halifax CountyRoanoke Rapids & Halifax | 55 | Balanced | 6.27 mos | 33 | $205,000 | 83 days | 98.3% | 27.3% | $1,375 | $868 | 3.9% |
| #20 | Tyrrell CountyColumbia | 53 | Balanced | 5.40 mos | 9 | $222,500 | 53 days | 93.0% | 26.6% | $1,401 | $968 | 3.9% |
| #21 | Northampton CountyJackson & Lake Gaston | 49 | Balanced | 6.42 mos | 24 | $158,000 | 76 days | 94.4% | 23.7% | $1,206 | $771 | 3.9% |
| #22 | Bertie CountyWindsor | 48 | Balanced | 6.58 mos | 34 | $142,000 | 34 days | 94.6% | 22.6% | $1,288 | $726 | 3.9% |
| #23 | Hyde CountySwan Quarter & Ocracoke | 43 | Softening | 9.75 mos | 12 | $215,000 | 48 days | 95.0% | 26.2% | $1,291 | $949 | 3.9% |
Build a Custom 2-to-4 County Comparison
Select 2 to 4 counties below to compare their supply pressure, prices, affordability, HUD 3BR Fair Market Rents, weekly wages, and closed sales side-by-side — then click Send This Multi-County Brief to My Inbox to pre-fill those counties in your weekly regional subscription.
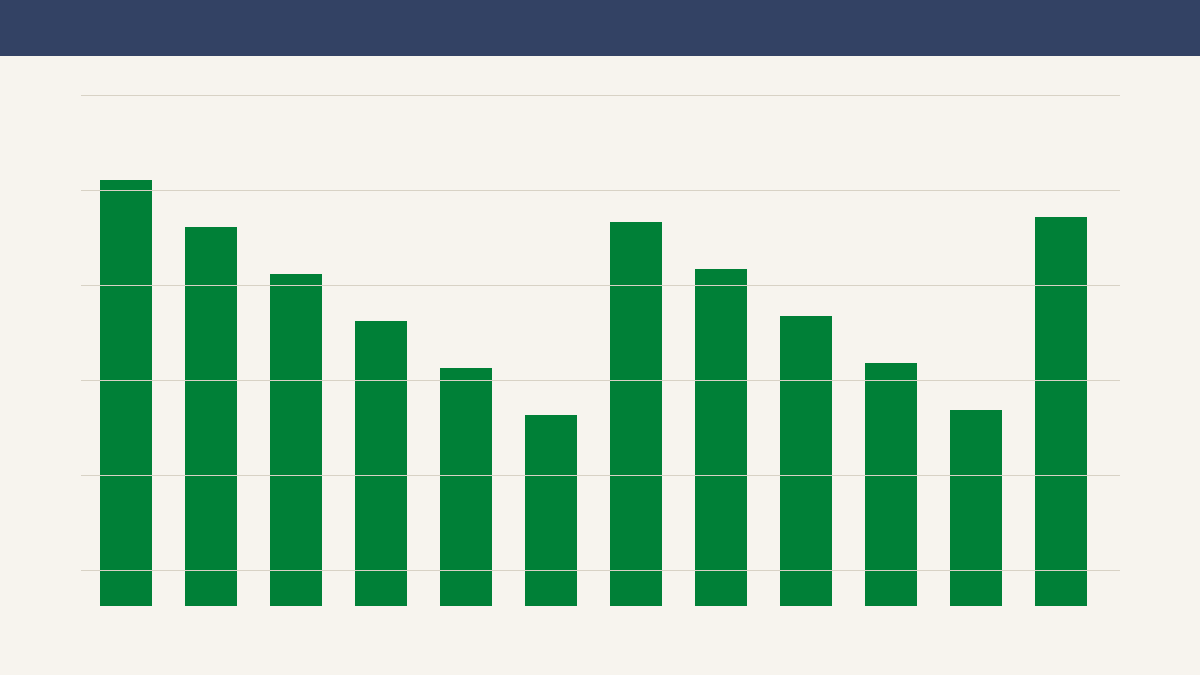
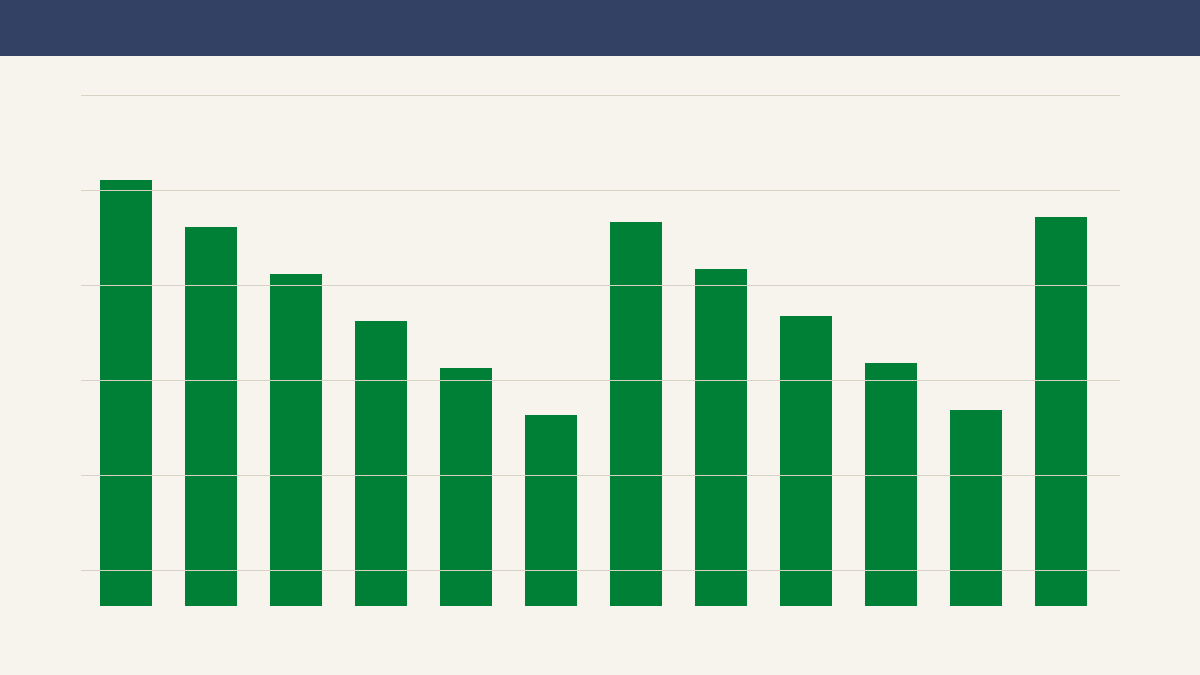
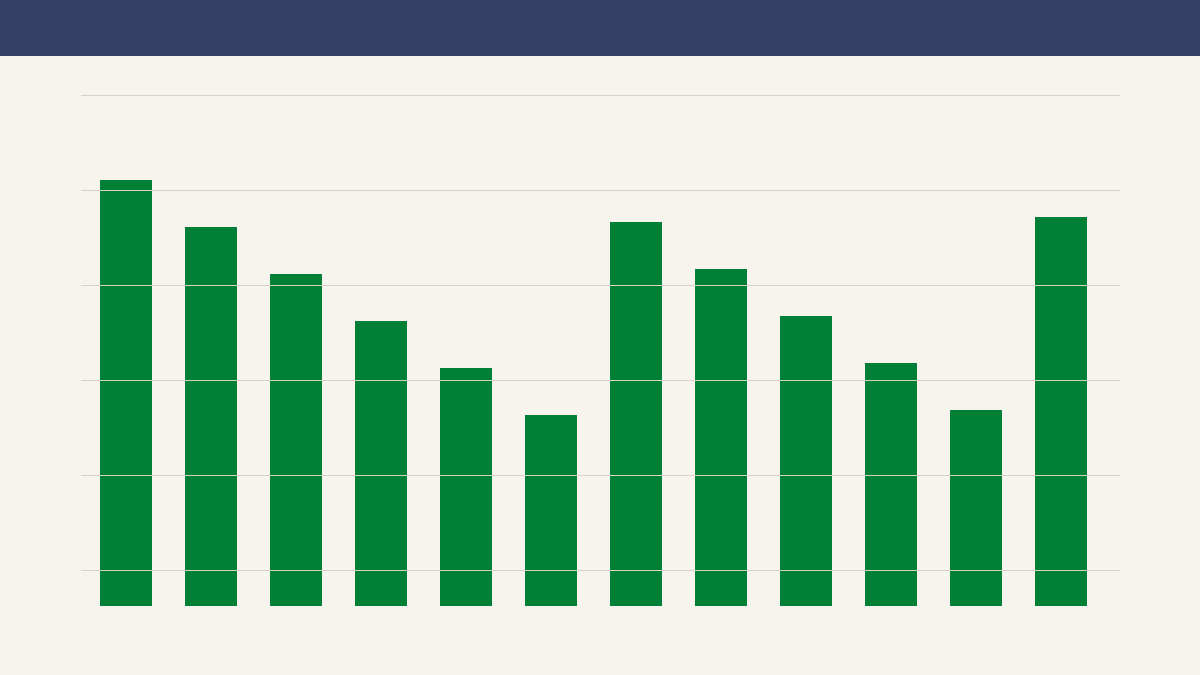
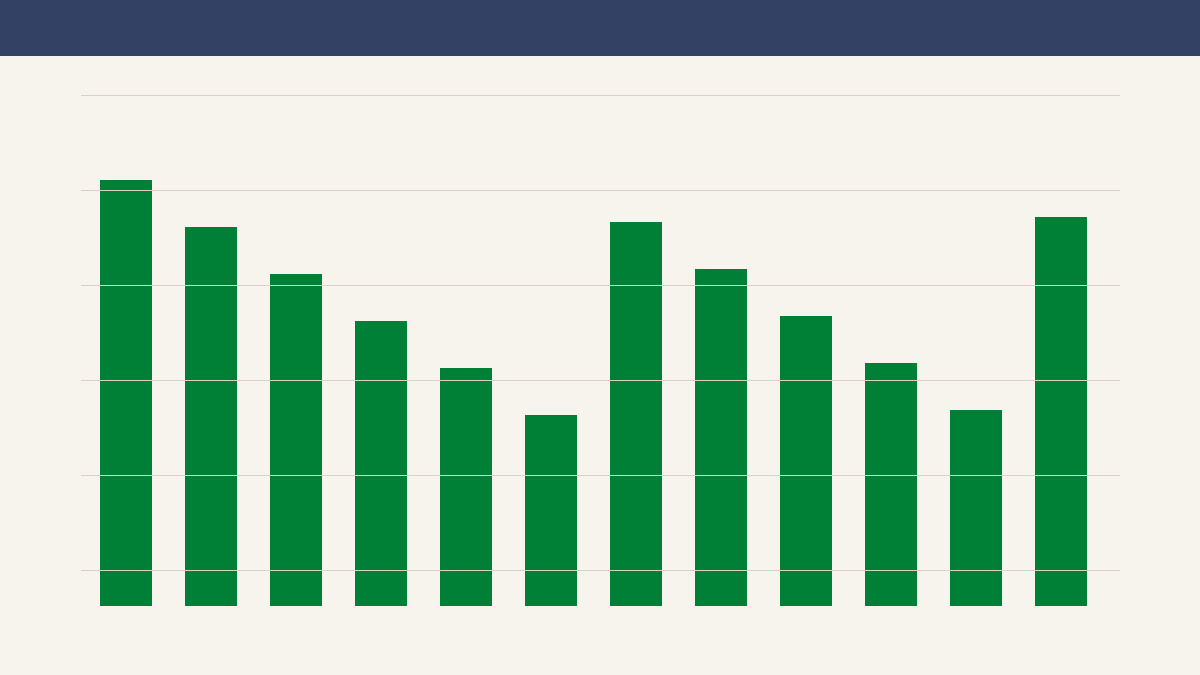
23-County Supply Trend, Listing Flow & Price History
UNLOCK FULL COUNTY REPORT + WEEKLY MONDAY BRIEFING
Unlock Sections 04–11 & Receive the Weekly Northeast NC Market Signal
Instant access to the complete institutional dataset on this page, plus the Monday morning edition with fresh Hive MLS, Freddie Mac PMMS, HUD FMR, and BLS construction benchmarks.
- Section 04: County vs. 23-County Region Quartile Distribution
- Section 05: Weekly Wages (QCEW), Expendable Income % & 5-Step Rate Sensitivity Ladder
- Section 06: HUD Fair Market Rents (0BR–4BR) & 13-Row Rent vs. Own Cost Ledger
- Section 07: NCRB Homeowners, Wind/Hail, NCIUA Beach Plan & FEMA Flood Breakdown
- Section 08: Local Economy, BLS PPI Build Costs, Audited NVR 10-K/10-Q Margins & 4 Builder Rules
- Sections 09–11: All 25 Deliverable Signals, 78-Quarter Empirical Correlations & 27 Sources